Time:2024-10-10
Introduction
This study presents the stability of specific impurities in Upatinib, a selective JAK inhibitor designed for the treatment of refractory moderate-to-severe atopic dermatitis in adults and adolescents aged 12 years and older who exhibit inadequate responses to or are unsuitable candidates for alternative systemic therapies, including hormonal or biologic agents.
Experimental plan
In this study, our center performed stability assessments of solutions containing three specific impurities of Upatinib, utilizing the methodology established by our laboratory. The sample numbers and structural formulas employed are illustrated in FIG. 1 and FIG. 2 below:
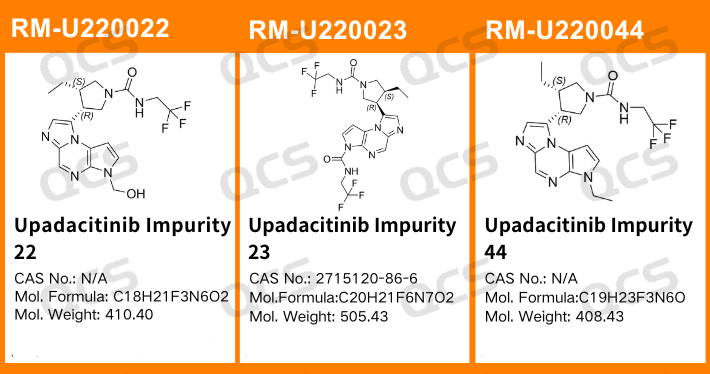
Figure 1: The impurity item numbers and structural formulas utilized in this study
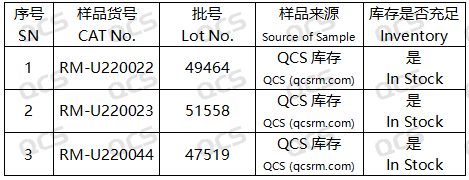
Figure 2: The correlation between the impurity codes specified in the standard and the impurity item numbers employed in this research
The chromatographic parameters of our self-developed method are detailed as follows:

Figure 3: Chromatographic parameters of our self-developed methodology.
In this study, our researchers utilized Impurity 22 (Upadacitinib Impurity 22), RM-U220023 (Upadacitinib Impurity 23; CAS NO: 2715120-86-6), and RM-U220044 (Upadacitinib Impurity 44). These impurities were subjected to acidic, neutral, and alkaline solutions respectively and maintained at room temperature and atmospheric pressure for durations of 0, 3, 6, 12, and 24 hours. The stability of the sample solution was assessed by monitoring changes in the main peak area on the chromatogram over time in reference to impurity profile established using the Department's self-developed method.
Experimental Conclusion
Following our testing, we observed that the primary peak-to-peak area of sample RM-U220044 exhibited minimal variation over a 24-hour period across acidic, neutral, and alkaline solutions, with all relative standard deviations remaining below 2.0%. Consequently, this sample is deemed to be relatively stable within these pH conditions for the duration of 24 hours. The data pertaining to the main peak area of sample RM-U220044 at each detection point under varying pH levels is presented as follows:
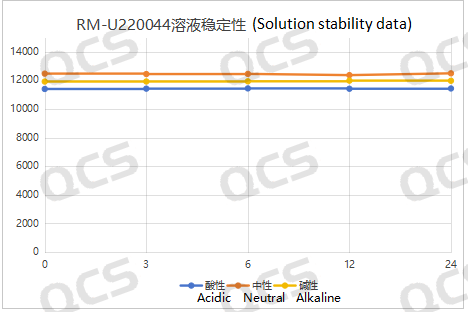
Figure 4: Schematic representation of the summary data on solution stability for sample RM-U220044
The main peak area of sample RM-U220022 exhibited minimal variation over a 24-hour period in both acidic and neutral solutions, with a relative standard deviation of less than 2.0%. In contrast, significant fluctuations in the main peak area were observed during the same duration in alkaline solution, resulting in a relative standard deviation of 19.28%. Furthermore, when comparing the sample at the initial time point (0 hours) in neutral solution, it was evident that degradation occurred during dissolution in alkaline conditions. Analysis of samples exposed to alkaline solution for durations of 0, 3, 6, 12, and 24 hours revealed that no further degradation took place after just 3 hours of exposure. Consequently, it can be concluded that the sample demonstrates stability in acidic and neutral environments while exhibiting instability under alkaline conditions. The data regarding the main peak area for sample RM-U220022 across various pH levels at each detection interval is presented as follows:
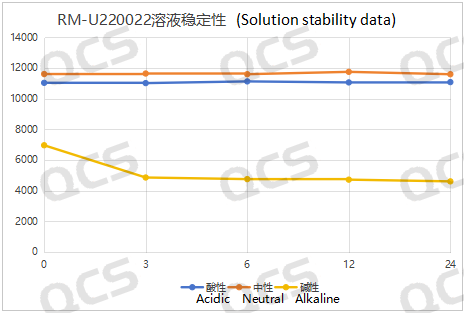
Figure 5: Line diagram summarizing the solution stability data for sample RM-U220022
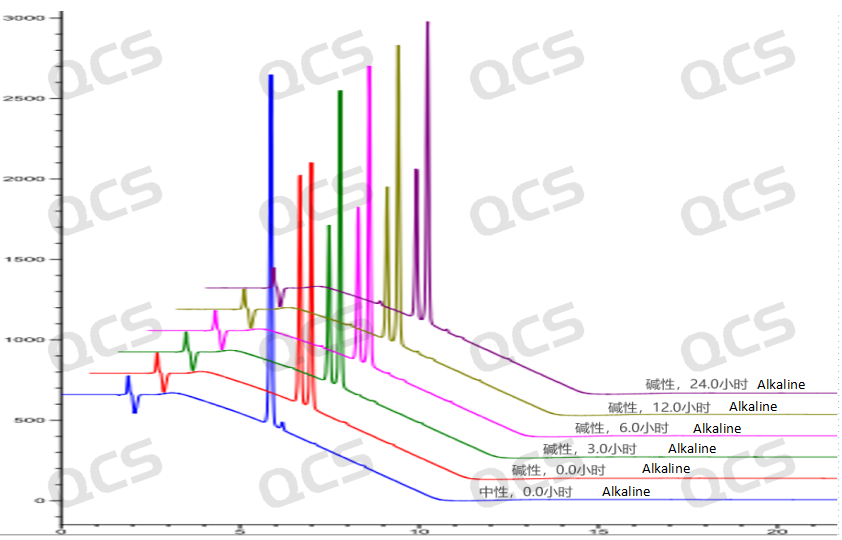
Figure 6: Three-dimensional overview of the fundamental solution stability data for sample RM-U220022
The main peak area of sample RM-U220023 exhibited minimal variation when immersed in acidic solution for 24 hours, with a relative standard deviation of less than 2.0%. In contrast, during the 24-hour exposure to neutral and alkaline solutions, significant fluctuations in the main peak area were observed, accompanied by a relative standard deviation exceeding 2.0%. The test results indicate that the sample undergoes continuous degradation over time when placed in neutral solution. Additionally, partial degradation occurs during dissolution with alkaline diluents, which continues as placement time extends; after 12 hours in alkaline solution, complete degradation of the sample is noted. Consequently, it can be concluded that the sample demonstrates instability when subjected to neutral and alkaline conditions for 24 hours while remaining stable under acidic conditions. The data regarding the main peak area of sample RM-U220023 at various detection points across different pH values are presented below:
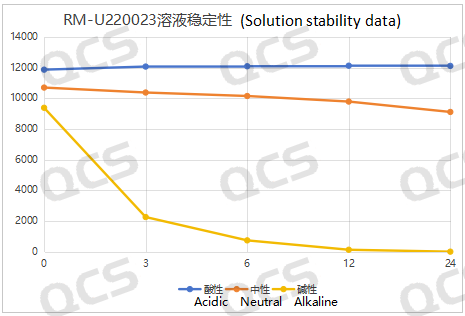
Figure 7: Line diagram summarizing the solution stability data for sample RM-U220023
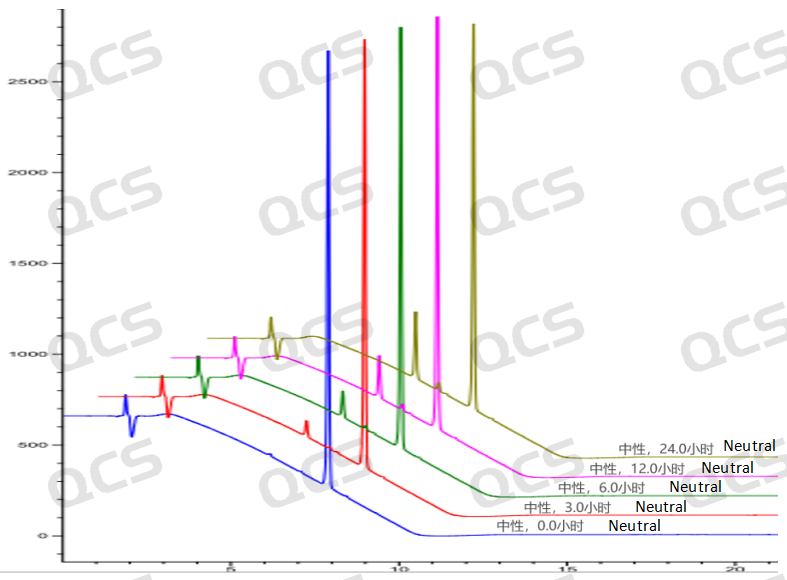
Figure 8: Three-dimensional summary of neutral solution stability data for sample RM-U220023
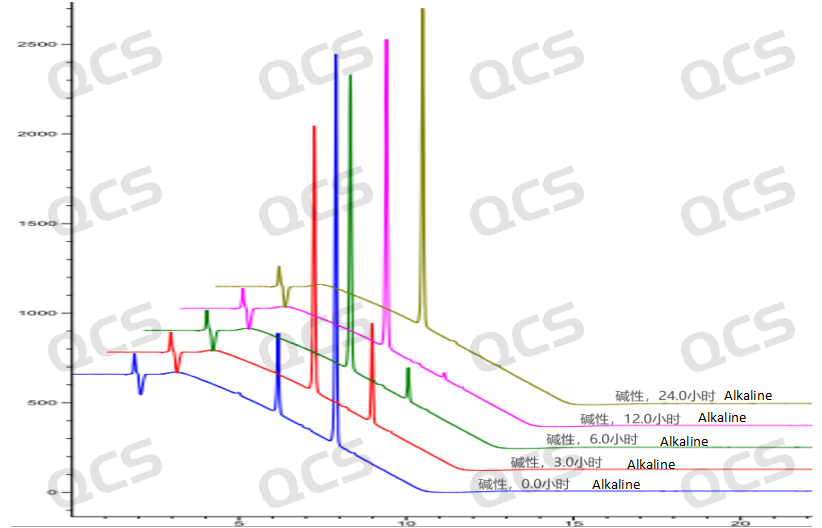
Figure 9: A three-dimensional summary of the fundamental stability data for sample RM-U220023
Summary
In conclusion, our experiment revealed that sample RM-U220044 exhibited commendable stability. Conversely, sample RM-U220022 demonstrated instability and degradation in alkaline solutions. Sample RM-U220023 remained stable in acidic environments but was unstable in neutral and alkaline conditions. Consequently, it is imperative to exercise caution regarding the usage, transportation, and storage of samples RM-U220022 and RM-U220023; they should not come into contact with alkalis, and on-site testing should be conducted whenever feasible. For inquiries concerning the stability characteristics of these three samples, please do not hesitate to contact our company.


Introduction
This study presents the stability of specific impurities in Upatinib, a selective JAK inhibitor designed for the treatment of refractory moderate-to-severe atopic dermatitis in adults and adolescents aged 12 years and older who exhibit inadequate responses to or are unsuitable candidates for alternative systemic therapies, including hormonal or biologic agents.
Experimental plan
In this study, our center performed stability assessments of solutions containing three specific impurities of Upatinib, utilizing the methodology established by our laboratory. The sample numbers and structural formulas employed are illustrated in FIG. 1 and FIG. 2 below:

Figure 1: The impurity item numbers and structural formulas utilized in this study

Figure 2: The correlation between the impurity codes specified in the standard and the impurity item numbers employed in this research
The chromatographic parameters of our self-developed method are detailed as follows:

Figure 3: Chromatographic parameters of our self-developed methodology.
In this study, our researchers utilized Impurity 22 (Upadacitinib Impurity 22), RM-U220023 (Upadacitinib Impurity 23; CAS NO: 2715120-86-6), and RM-U220044 (Upadacitinib Impurity 44). These impurities were subjected to acidic, neutral, and alkaline solutions respectively and maintained at room temperature and atmospheric pressure for durations of 0, 3, 6, 12, and 24 hours. The stability of the sample solution was assessed by monitoring changes in the main peak area on the chromatogram over time in reference to impurity profile established using the Department's self-developed method.
Experimental Conclusion
Following our testing, we observed that the primary peak-to-peak area of sample RM-U220044 exhibited minimal variation over a 24-hour period across acidic, neutral, and alkaline solutions, with all relative standard deviations remaining below 2.0%. Consequently, this sample is deemed to be relatively stable within these pH conditions for the duration of 24 hours. The data pertaining to the main peak area of sample RM-U220044 at each detection point under varying pH levels is presented as follows:

Figure 4: Schematic representation of the summary data on solution stability for sample RM-U220044
The main peak area of sample RM-U220022 exhibited minimal variation over a 24-hour period in both acidic and neutral solutions, with a relative standard deviation of less than 2.0%. In contrast, significant fluctuations in the main peak area were observed during the same duration in alkaline solution, resulting in a relative standard deviation of 19.28%. Furthermore, when comparing the sample at the initial time point (0 hours) in neutral solution, it was evident that degradation occurred during dissolution in alkaline conditions. Analysis of samples exposed to alkaline solution for durations of 0, 3, 6, 12, and 24 hours revealed that no further degradation took place after just 3 hours of exposure. Consequently, it can be concluded that the sample demonstrates stability in acidic and neutral environments while exhibiting instability under alkaline conditions. The data regarding the main peak area for sample RM-U220022 across various pH levels at each detection interval is presented as follows:

Figure 5: Line diagram summarizing the solution stability data for sample RM-U220022

Figure 6: Three-dimensional overview of the fundamental solution stability data for sample RM-U220022
The main peak area of sample RM-U220023 exhibited minimal variation when immersed in acidic solution for 24 hours, with a relative standard deviation of less than 2.0%. In contrast, during the 24-hour exposure to neutral and alkaline solutions, significant fluctuations in the main peak area were observed, accompanied by a relative standard deviation exceeding 2.0%. The test results indicate that the sample undergoes continuous degradation over time when placed in neutral solution. Additionally, partial degradation occurs during dissolution with alkaline diluents, which continues as placement time extends; after 12 hours in alkaline solution, complete degradation of the sample is noted. Consequently, it can be concluded that the sample demonstrates instability when subjected to neutral and alkaline conditions for 24 hours while remaining stable under acidic conditions. The data regarding the main peak area of sample RM-U220023 at various detection points across different pH values are presented below:

Figure 7: Line diagram summarizing the solution stability data for sample RM-U220023

Figure 8: Three-dimensional summary of neutral solution stability data for sample RM-U220023

Figure 9: A three-dimensional summary of the fundamental stability data for sample RM-U220023
Summary
In conclusion, our experiment revealed that sample RM-U220044 exhibited commendable stability. Conversely, sample RM-U220022 demonstrated instability and degradation in alkaline solutions. Sample RM-U220023 remained stable in acidic environments but was unstable in neutral and alkaline conditions. Consequently, it is imperative to exercise caution regarding the usage, transportation, and storage of samples RM-U220022 and RM-U220023; they should not come into contact with alkalis, and on-site testing should be conducted whenever feasible. For inquiries concerning the stability characteristics of these three samples, please do not hesitate to contact our company.


Join Our Email List
Subscribe to receive updates on new
products, promotions and resources!
Join Our Email List
Subscribe to receive updates on new
products, promotions and resources!
| ISO 17034:2016 |
| ISO 9001:2015 |

*All our products are for R&D.

*All our products are for R&D.
Copyright © 2021-2024 QCSRM All rights reserved. 粤ICP备2023004355号
Copyright © 2021-2024 QCSRM All rights reserved.
粤ICP备2023004355号