

Time:2026-05-06

High-performance liquid chromatography (HPLC) is a widely used instrumental analysis method in pharmaceutical quality control for both qualitative and quantitative analysis of compounds. However, due to frequent discrepancies between the solvents employed for sample dissolution and those used as the mobile phase within the chromatographic system, solvent effects may occasionally occur, leading to peak distortion, retention drift, and impaired separation performance, thereby significantly compromising the accuracy of HPLC-based qualitative and quantitative analyses.
During HPLC analysis of isavuconazole impurity RM-I192220 (Isavuconazole Impurity 20/BAL19714; CAS No.: 2733698-17-2), our laboratory observed solvent-induced peak shape distortion. Consequently, we investigated the quantitative relationship between solvent effects and peak distortion, compiling data for reference to facilitate comparative analysis and corrective measures when similar phenomena occur in HPLC analyses, thereby preventing erroneous interpretation of results.
I. Research Background: Abnormal Infrared Data
In December 2021, Etopiconazole Sulfate Capsules were approved for marketing by the National Medical Products Administration (NMPA), with the approved indication being: treatment of invasive aspergillosis and mycosis infundibulare in adults, making it the first oral antifungal agent approved in China for the treatment of invasive mycosis infundibulare in adults.
Currently, none of the international pharmacopoeias include quality standards for this drug; domestically, only registration standards exist for imported products. Both the registration standards for Eksacandazole Sulfate Capsules and Injection specify controlled impurity BAL19714, which exhibits a relative retention time (RRT) of 0.36, peaks early in the chromatogram, and is relatively more susceptible to solvent effects. During testing, we observed that the chromatographic behavior of this impurity peak correlates with the proportion of organic phase in the solvent. Consequently, we conducted experimental studies focusing on analyzing the relationship between the proportion of acetonitrile in the solvent, injection volume, and peak shape when impurity BAL19714 was dissolved in varying acetonitrile concentrations.
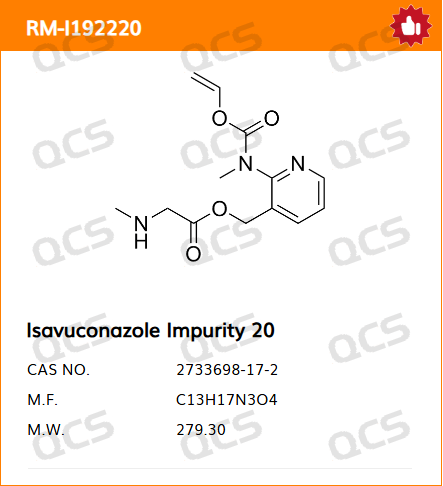
Figure 1: Structure of the impurity BAL19714
II. Results Discussion
1 Experimental Design
Instrument: Thermo U3000 High Performance Liquid Chromatograph
Chromatographic Conditions: Method for Determining Relevant Substances in the Registration Standard of Etopiconazole Sulfate Preparation
sample solution
· Sample solution 1 (8 mg/mL, solvent: 15% acetonitrile)
· Sample solution 2 (1 mg/mL, solvent: 15% acetonitrile)
· Sample solution 3 (1 mg/mL, solvent: 25% acetonitrile)
· Sample solution 4 (1 mg/ml, solvent: 50% acetonitrile)
experimental scheme
Examine each single-factor variable separately:
(1) Proportion of acetonitrile in the solvent;
(2) Concentration of impurity solution;
(3) Effect of injection volume on chromatographic peak shape.
2. Atlas Data
(1) Single-factor variable – Acetonitrile proportion in the solvent
Figure 2: Single-factor variable – Acetonitrile proportion in the solvent – Comparison plot·
Ø Data Analysis: Solutions of impurities with identical concentrations were prepared using 15%,25%, and 50% acetonitrile as solvents, with 50 μl injected each. It was found that 15% acetonitrile as the solvent did not significantly cause peak distortion, making it the most preferred solvent.。
·
(2) Single-factor variable – Impurity solution concentration
Figure 3: Univariate analysis – Impurity solution concentration – Comparison plot
Ø Data Analysis: Using 15% acetonitrile as the solvent, impurity solutions with concentrations of 1 mg/mL and 8 mg/mL were prepared, with 20 μL injected for each. The main peak height of the 1 mg/mL impurity solution was approximately 300 mAU, whereas that of the 0.05% solution (which falls below the detection limit specified in this registration standard) was only 0.15 mAU. Considering the instrument sensitivity, 8 mg/mL is the more preferred concentration for purity determination.
(3) Single-factor variable – Injection volume
Figure 4: Single-factor variable – Injection volume (solvent: 15% acetonitrile) – Comparison plot
Ø Data Analysis: Using 15% acetonitrile as the solvent, an impurity solution with a concentration of 1 mg/mL was prepared, and samples of 20,50,70, and 100 μL were injected respectively. When the injection volume reached 70 μL, the peak shape began to distort.
Figure 5: Single-factor variable – Injection volume (solvent: 25% acetonitrile) – Comparison plot
Ø Data Analysis: Using 25% acetonitrile as the solvent, an impurity solution with a concentration of 1 mg/mL was prepared, and samples of 20,50,70, and 100 μL were injected respectively. When the injection volume reached 50 μL, the peak shape began to distort.
Figure 6: Single-factor variable – Injection volume (solvent: 50% acetonitrile) – Comparison plot
Ø Data Analysis: Using 50% acetonitrile as the solvent, an impurity solution with a concentration of 1 mg/mL was prepared and injected at volumes of 10,20,30, and 50 μL. When the injection volume reached 20 μL, the peak shape began to distort.
Figure 7: Relationship between acetonitrile concentration in the solvent and peak distortion – Comparative plot
In summary, when the acetonitrile concentration in the sample solution injected into the chromatographic system reaches 10 μL, the minor impurity peaks detected before the main peak begin to broaden and gradually split as the acetonitrile concentration increases; at 15 μL, the main peak becomes distorted; and at 20 μL, it splits into multiple peaks due to significantly early elution, as shown in Figure 7. Therefore, the acetonitrile proportion in the solvent should not exceed 25%, with 20 μL being the optimal injection volume.
3. Conclusion
The initial organic phase ratio in the gradient program for the substance detection method specified in this registration standard is 2.5%, with acetonitrile constituting 15% of the sample solvent, and an injection volume of 20 μL. The results from this study demonstrate that the parameter settings of this method are appropriate.
The initial organic phase ratio in this method is only 2.5%. Under such a low organic phase ratio in the mobile phase system, introducing excessive solvents with strong elution capacity can cause components in the sample to be eluted prematurely, leading to chromatographic peak distortion—particularly affecting those components that elute early. The stronger the solvent's elution capacity, the more pronounced the peak distortion, following a progressive relationship.
III. Summary of Experiences
The injection of the sample solution can be regarded as a transient alteration to the mobile phase of the chromatographic system. However, to avoid disrupting the equilibrium state, solvents with elution properties closely resembling those of the mobile phase should be preferred whenever possible. Nevertheless, considering factors such as sample solubility and solution stability, the use of solvents with stronger elution capabilities remains unavoidable.
TIPS | Suggestions
1. Preferably select a solvent that closely resembles the mobile phase; if the mobile phase itself is used as the solvent, or a solvent with an organic phase ratio similar to but lower than that of the mobile phase, the adverse effects associated with a lower organic phase ratio are generally minimal.
2. When using a solvent with a higher organic phase ratio, the solvent effect can be mitigated by reducing the injection volume; however, it is still necessary to consider whether the solute may precipitate in the mobile phase after injection, which could lead to delayed peak appearance and tailing effects.
3. If abnormal chromatographic peak shapes are observed, the presence of solvent effects can be investigated by reducing the injection volume or decreasing the organic phase ratio.
4. A solvent effect eliminator or additional tubing can be installed before the chromatographic column to ensure that the injected components fully diffuse into the mobile phase, thereby mitigating solvent effects to some extent.


High-performance liquid chromatography (HPLC) is a widely used instrumental analysis method in pharmaceutical quality control for both qualitative and quantitative analysis of compounds. However, due to frequent discrepancies between the solvents employed for sample dissolution and those used as the mobile phase within the chromatographic system, solvent effects may occasionally occur, leading to peak distortion, retention drift, and impaired separation performance, thereby significantly compromising the accuracy of HPLC-based qualitative and quantitative analyses.
During HPLC analysis of isavuconazole impurity RM-I192220 (Isavuconazole Impurity 20/BAL19714; CAS No.: 2733698-17-2), our laboratory observed solvent-induced peak shape distortion. Consequently, we investigated the quantitative relationship between solvent effects and peak distortion, compiling data for reference to facilitate comparative analysis and corrective measures when similar phenomena occur in HPLC analyses, thereby preventing erroneous interpretation of results.
I. Research Background: Abnormal Infrared Data
In December 2021, Etopiconazole Sulfate Capsules were approved for marketing by the National Medical Products Administration (NMPA), with the approved indication being: treatment of invasive aspergillosis and mycosis infundibulare in adults, making it the first oral antifungal agent approved in China for the treatment of invasive mycosis infundibulare in adults.
Currently, none of the international pharmacopoeias include quality standards for this drug; domestically, only registration standards exist for imported products. Both the registration standards for Eksacandazole Sulfate Capsules and Injection specify controlled impurity BAL19714, which exhibits a relative retention time (RRT) of 0.36, peaks early in the chromatogram, and is relatively more susceptible to solvent effects. During testing, we observed that the chromatographic behavior of this impurity peak correlates with the proportion of organic phase in the solvent. Consequently, we conducted experimental studies focusing on analyzing the relationship between the proportion of acetonitrile in the solvent, injection volume, and peak shape when impurity BAL19714 was dissolved in varying acetonitrile concentrations.
Figure 1: Structure of the impurity BAL19714
II. Results Discussion
1 Experimental Design
Instrument: Thermo U3000 High Performance Liquid Chromatograph
Chromatographic Conditions: Method for Determining Relevant Substances in the Registration Standard of Etopiconazole Sulfate Preparation
sample solution
· Sample solution 1 (8 mg/mL, solvent: 15% acetonitrile)
· Sample solution 2 (1 mg/mL, solvent: 15% acetonitrile)
· Sample solution 3 (1 mg/mL, solvent: 25% acetonitrile)
· Sample solution 4 (1 mg/ml, solvent: 50% acetonitrile)
experimental scheme
Examine each single-factor variable separately:
(1) Proportion of acetonitrile in the solvent;
(2) Concentration of impurity solution;
(3) Effect of injection volume on chromatographic peak shape.
2. Atlas Data
(1) Single-factor variable – Acetonitrile proportion in the solvent
Figure 2: Single-factor variable – Acetonitrile proportion in the solvent – Comparison plot·
Ø Data Analysis: Solutions of impurities with identical concentrations were prepared using 15%,25%, and 50% acetonitrile as solvents, with 50 μl injected each. It was found that 15% acetonitrile as the solvent did not significantly cause peak distortion, making it the most preferred solvent.。
·
(2) Single-factor variable – Impurity solution concentration
Figure 3: Univariate analysis – Impurity solution concentration – Comparison plot
Ø Data Analysis: Using 15% acetonitrile as the solvent, impurity solutions with concentrations of 1 mg/mL and 8 mg/mL were prepared, with 20 μL injected for each. The main peak height of the 1 mg/mL impurity solution was approximately 300 mAU, whereas that of the 0.05% solution (which falls below the detection limit specified in this registration standard) was only 0.15 mAU. Considering the instrument sensitivity, 8 mg/mL is the more preferred concentration for purity determination.
(3) Single-factor variable – Injection volume
Figure 4: Single-factor variable – Injection volume (solvent: 15% acetonitrile) – Comparison plot
Ø Data Analysis: Using 15% acetonitrile as the solvent, an impurity solution with a concentration of 1 mg/mL was prepared, and samples of 20,50,70, and 100 μL were injected respectively. When the injection volume reached 70 μL, the peak shape began to distort.
Figure 5: Single-factor variable – Injection volume (solvent: 25% acetonitrile) – Comparison plot
Ø Data Analysis: Using 25% acetonitrile as the solvent, an impurity solution with a concentration of 1 mg/mL was prepared, and samples of 20,50,70, and 100 μL were injected respectively. When the injection volume reached 50 μL, the peak shape began to distort.
Figure 6: Single-factor variable – Injection volume (solvent: 50% acetonitrile) – Comparison plot
Ø Data Analysis: Using 50% acetonitrile as the solvent, an impurity solution with a concentration of 1 mg/mL was prepared and injected at volumes of 10,20,30, and 50 μL. When the injection volume reached 20 μL, the peak shape began to distort.
Figure 7: Relationship between acetonitrile concentration in the solvent and peak distortion – Comparative plot
In summary, when the acetonitrile concentration in the sample solution injected into the chromatographic system reaches 10 μL, the minor impurity peaks detected before the main peak begin to broaden and gradually split as the acetonitrile concentration increases; at 15 μL, the main peak becomes distorted; and at 20 μL, it splits into multiple peaks due to significantly early elution, as shown in Figure 7. Therefore, the acetonitrile proportion in the solvent should not exceed 25%, with 20 μL being the optimal injection volume.
3. Conclusion
The initial organic phase ratio in the gradient program for the substance detection method specified in this registration standard is 2.5%, with acetonitrile constituting 15% of the sample solvent, and an injection volume of 20 μL. The results from this study demonstrate that the parameter settings of this method are appropriate.
The initial organic phase ratio in this method is only 2.5%. Under such a low organic phase ratio in the mobile phase system, introducing excessive solvents with strong elution capacity can cause components in the sample to be eluted prematurely, leading to chromatographic peak distortion—particularly affecting those components that elute early. The stronger the solvent's elution capacity, the more pronounced the peak distortion, following a progressive relationship.
III. Summary of Experiences
The injection of the sample solution can be regarded as a transient alteration to the mobile phase of the chromatographic system. However, to avoid disrupting the equilibrium state, solvents with elution properties closely resembling those of the mobile phase should be preferred whenever possible. Nevertheless, considering factors such as sample solubility and solution stability, the use of solvents with stronger elution capabilities remains unavoidable.
TIPS | Suggestions
1. Preferably select a solvent that closely resembles the mobile phase; if the mobile phase itself is used as the solvent, or a solvent with an organic phase ratio similar to but lower than that of the mobile phase, the adverse effects associated with a lower organic phase ratio are generally minimal.
2. When using a solvent with a higher organic phase ratio, the solvent effect can be mitigated by reducing the injection volume; however, it is still necessary to consider whether the solute may precipitate in the mobile phase after injection, which could lead to delayed peak appearance and tailing effects.
3. If abnormal chromatographic peak shapes are observed, the presence of solvent effects can be investigated by reducing the injection volume or decreasing the organic phase ratio.
4. A solvent effect eliminator or additional tubing can be installed before the chromatographic column to ensure that the injected components fully diffuse into the mobile phase, thereby mitigating solvent effects to some extent.
Join Our Email List
Subscribe to receive updates on new
products, promotions and resources!
Join Our Email List
Subscribe to receive updates on new
products, promotions and resources!
| ISO 17034:2016 |  |
| ISO 9001:2015 | |






 |
 |
 |
 |
*All our products are for R&D.
|
|
|
|
*All our products are for R&D.
Copyright © 2021-2024 QCSRM All rights reserved. 粤ICP备2023004355号
Copyright © 2021-2024 QCSRM All rights reserved.
粤ICP备2023004355号