Time:2025-02-26
Today, we will share the study on the stability of specific impurities of salmeterol, a new type of selective long-acting β2 receptor agonist. Salmeterol is a new type of selective long-acting β2 receptor agonist, which has a powerful effect of inhibiting the release of allergic reaction mediators from pulmonary mast cells. It can inhibit both the early and late phase reactions induced by inhaled antigens and reduce airway hyperresponsiveness. It is used for asthma (including nocturnal asthma and exercise-induced asthma), asthmatic bronchitis, and reversible airway obstruction.
Experimental scheme
In this experiment, our center conducted a solution stability study on three specific impurities of salmeterol, referring to the chromatographic conditions used in the item "Related substances" under the variety item "SALMETEROL XINAFOATE" in the 11.0th edition of the European Pharmacopoeia. The item numbers and structural formulas of the samples used are shown in Figure 1 and Figure 2 as follows:
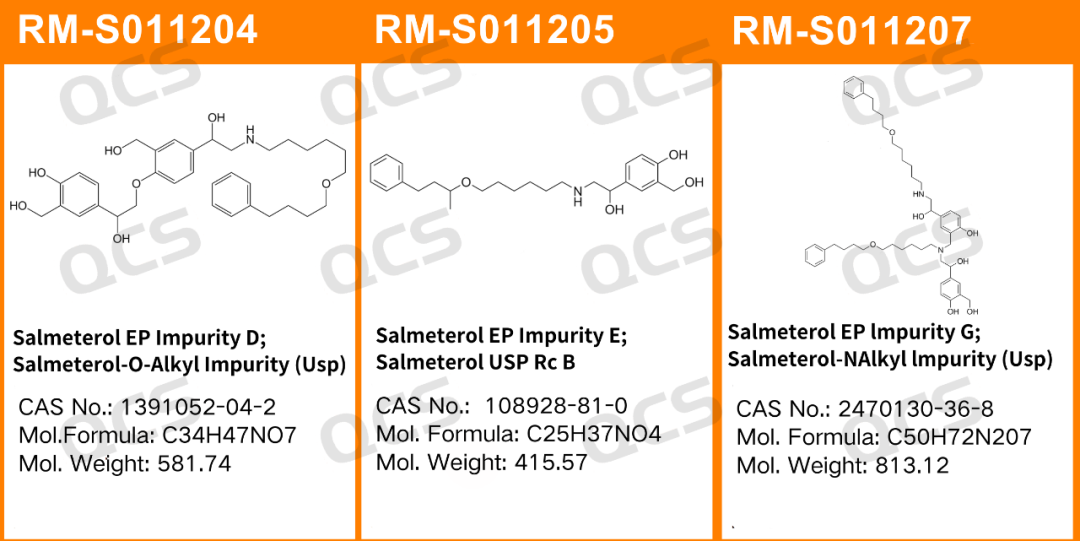
Figure 1: Item numbers and structural formulas of the impurities used in this study

Figure 2: The corresponding relationship diagram between the impurity codes included in the standard and the item numbers of the impurities used in this study
In this experiment, the experimenter took appropriate amounts of RM-S011204 (EP Impurity D; Salmeterol EP Impurity D; Salmeterol-O-Alkyl Impurity (Usp); CAS No: 1391052-04-2), RM-S011205 (EP Impurity E; Salmeterol EP Impurity E; Salmeterol USP Rc B; CAS No: 108928-81-0), and RM-S011207 (EP Impurity G; Salmeterol EP Impurity G; Salmeterol-N-Alkyl Impurity (Usp); CAS No: 2470130-36-8), and placed them in acidic, neutral, and alkaline solutions respectively. After being placed at room temperature and normal pressure for 0, 3, 6, 12, and 24 hours respectively, the samples were injected and detected according to the chromatographic conditions used in the item "Related substances" under the variety item "SALMETEROL XINAFOATE" in the 11.0th edition of the European Pharmacopoeia of our company. Observe the change in the peak area of the main peak in the chromatogram as the storage time of the sample solution increases, and use this as the basis to determine the solution stability of the sample.
Experiment conclusion
RM-S011204 (EP Impurity D)
After detection, it was found that for the sample RM-S011204 (EP Impurity D), the peak area of the main peak did not change significantly during the 24-hour period when it was placed in acidic, neutral, and alkaline solutions, and the relative standard deviation was less than 2.0%. Therefore, it can be considered that this sample is relatively stable during the 24-hour period when it is placed in acidic, neutral, and alkaline solutions. The peak area data of the main peak of the sample RM-S011204 (EP Impurity D) at each detection point under various pH conditions are as follows:
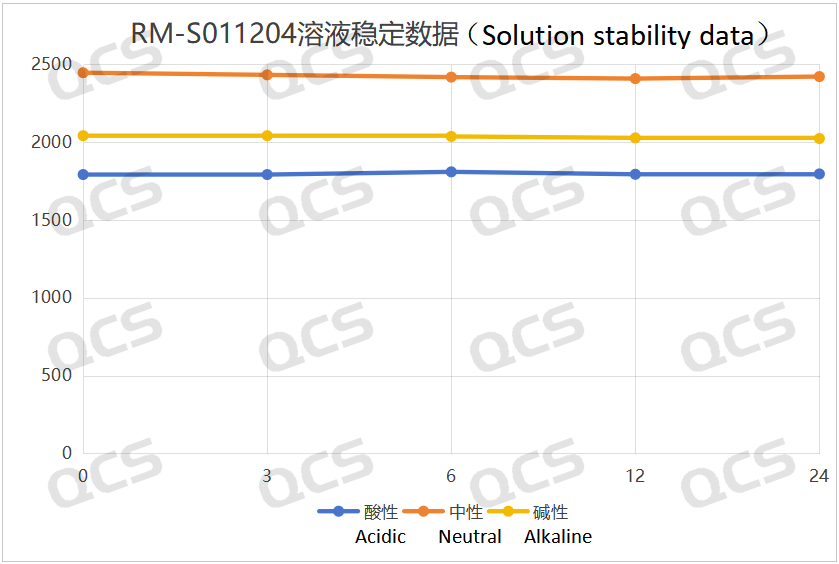
Figure 3: The line chart summarizing the solution stability data of the sample RM-S011204 (EP Impurity D)
RM-S011205 (EP Impurity E)
After detection, it was found that for the sample RM-S011205 (EP Impurity E), the peak area of the main peak did not change significantly during the 24-hour period when it was placed in acidic and neutral solutions, and the relative standard deviation was less than 2.0%. Therefore, it can be considered that this sample is relatively stable during the 24-hour period when it is placed in acidic and neutral solutions. However, the peak area of the main peak of this sample changed significantly during the 24-hour period when it was placed in an alkaline solution, with a relative standard deviation of 2.24%. As the storage time increases, the peak area of the main peak continuously decreases, and the peak area of the impurity continuously increases, indicating that this sample will gradually degrade over time when placed in an alkaline solution. The peak area data of the main peak of the sample RM-S011205 (EP Impurity E) at each detection point under various pH conditions are as follows:
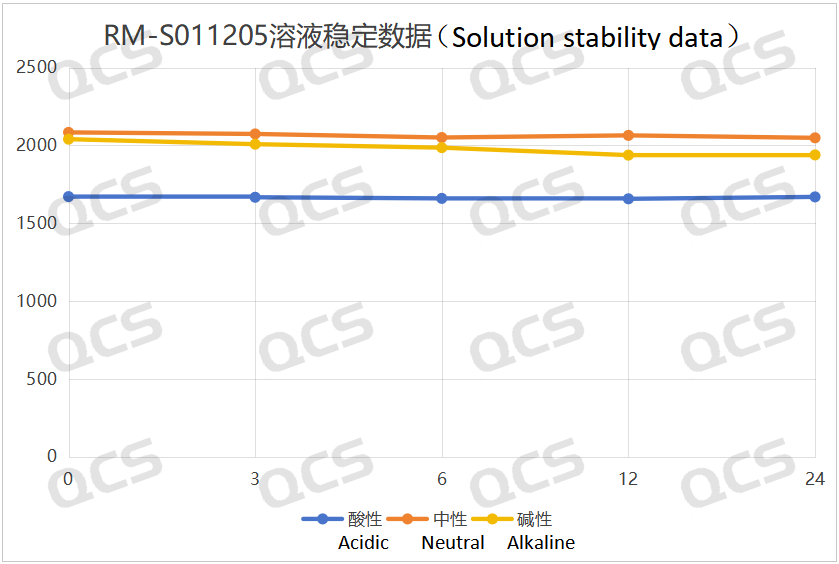
Figure 4: The line chart summarizing the stability data of the alkaline solution of the sample RM-S011205 (EP Impurity E)
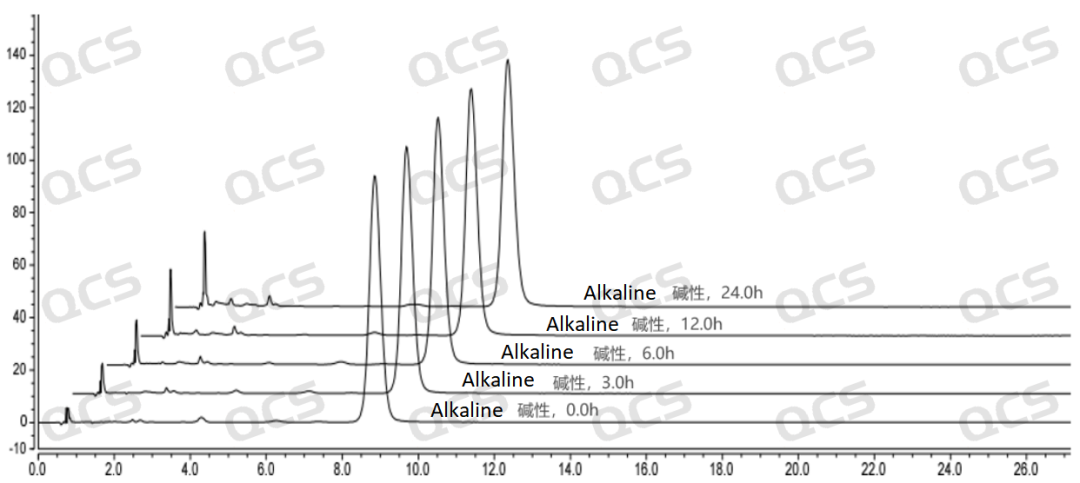
Figure 5: The 3D chart summarizing the stability data of the alkaline solution of the sample RM-S011205 (EP Impurity E)
RM-S011207 (EP Impurity G)
After detection, it was found that for the sample RM-S011207 (EP Impurity G), the peak area of the main peak did not change significantly during the 24-hour period when it was placed in acidic and neutral solutions, and the relative standard deviation was less than 2.0%. Therefore, it can be considered that this sample is relatively stable during the 24-hour period when it is placed in acidic and neutral solutions. However, the peak area of the main peak of this sample changed significantly during the 24-hour period when it was placed in an alkaline solution, with a relative standard deviation of 3.26%. As the storage time increases, the peak area of the main peak continuously decreases, and the peak area of the impurity continuously increases, indicating that this sample will gradually degrade over time when placed in an alkaline solution. The peak area data of the main peak of the sample RM-S011207 (EP Impurity G) at each detection point under various pH conditions are as follows:

Figure 6: The line chart summarizing the stability data of the alkaline solution of the sample RM-S011207 (EP Impurity G)
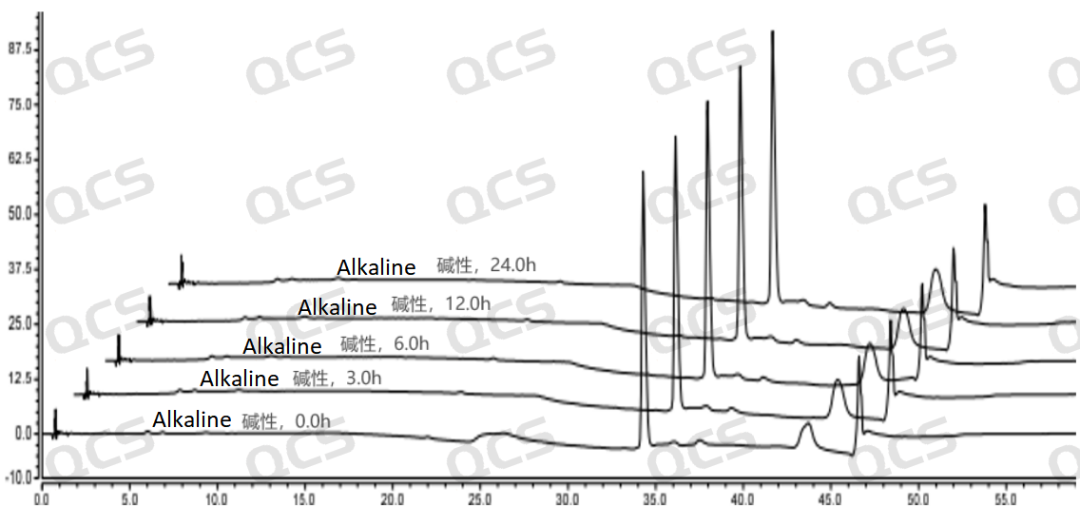
Figure 7: The 3D chart summarizing the stability data of the alkaline solution of the sample RM-S011207 (EP Impurity G)
summary
In conclusion, through this experiment, we found that the sample RM-S011204 (EP Impurity D) has good stability in acidic, neutral, and alkaline solutions. While the samples RM-S011205 (EP Impurity E) and RM-S011207 (EP Impurity G) are stable in acidic and neutral solutions, but they are unstable in alkaline solutions and will gradually degrade slowly over time when placed in alkaline solutions. Therefore, customers should avoid contact with alkalis when using, transporting, and storing the samples RM-S011205 (EP Impurity E) and RM-S011207 (EP Impurity G), and the samples should be prepared and tested immediately during detection. If customers need information about the stability of these three samples, they can consult our company.

Today, we will share the study on the stability of specific impurities of salmeterol, a new type of selective long-acting β2 receptor agonist. Salmeterol is a new type of selective long-acting β2 receptor agonist, which has a powerful effect of inhibiting the release of allergic reaction mediators from pulmonary mast cells. It can inhibit both the early and late phase reactions induced by inhaled antigens and reduce airway hyperresponsiveness. It is used for asthma (including nocturnal asthma and exercise-induced asthma), asthmatic bronchitis, and reversible airway obstruction.
Experimental scheme
In this experiment, our center conducted a solution stability study on three specific impurities of salmeterol, referring to the chromatographic conditions used in the item "Related substances" under the variety item "SALMETEROL XINAFOATE" in the 11.0th edition of the European Pharmacopoeia. The item numbers and structural formulas of the samples used are shown in Figure 1 and Figure 2 as follows:

Figure 1: Item numbers and structural formulas of the impurities used in this study

Figure 2: The corresponding relationship diagram between the impurity codes included in the standard and the item numbers of the impurities used in this study
In this experiment, the experimenter took appropriate amounts of RM-S011204 (EP Impurity D; Salmeterol EP Impurity D; Salmeterol-O-Alkyl Impurity (Usp); CAS No: 1391052-04-2), RM-S011205 (EP Impurity E; Salmeterol EP Impurity E; Salmeterol USP Rc B; CAS No: 108928-81-0), and RM-S011207 (EP Impurity G; Salmeterol EP Impurity G; Salmeterol-N-Alkyl Impurity (Usp); CAS No: 2470130-36-8), and placed them in acidic, neutral, and alkaline solutions respectively. After being placed at room temperature and normal pressure for 0, 3, 6, 12, and 24 hours respectively, the samples were injected and detected according to the chromatographic conditions used in the item "Related substances" under the variety item "SALMETEROL XINAFOATE" in the 11.0th edition of the European Pharmacopoeia of our company. Observe the change in the peak area of the main peak in the chromatogram as the storage time of the sample solution increases, and use this as the basis to determine the solution stability of the sample.
Experiment conclusion
RM-S011204 (EP Impurity D)
After detection, it was found that for the sample RM-S011204 (EP Impurity D), the peak area of the main peak did not change significantly during the 24-hour period when it was placed in acidic, neutral, and alkaline solutions, and the relative standard deviation was less than 2.0%. Therefore, it can be considered that this sample is relatively stable during the 24-hour period when it is placed in acidic, neutral, and alkaline solutions. The peak area data of the main peak of the sample RM-S011204 (EP Impurity D) at each detection point under various pH conditions are as follows:

Figure 3: The line chart summarizing the solution stability data of the sample RM-S011204 (EP Impurity D)
RM-S011205 (EP Impurity E)
After detection, it was found that for the sample RM-S011205 (EP Impurity E), the peak area of the main peak did not change significantly during the 24-hour period when it was placed in acidic and neutral solutions, and the relative standard deviation was less than 2.0%. Therefore, it can be considered that this sample is relatively stable during the 24-hour period when it is placed in acidic and neutral solutions. However, the peak area of the main peak of this sample changed significantly during the 24-hour period when it was placed in an alkaline solution, with a relative standard deviation of 2.24%. As the storage time increases, the peak area of the main peak continuously decreases, and the peak area of the impurity continuously increases, indicating that this sample will gradually degrade over time when placed in an alkaline solution. The peak area data of the main peak of the sample RM-S011205 (EP Impurity E) at each detection point under various pH conditions are as follows:

Figure 4: The line chart summarizing the stability data of the alkaline solution of the sample RM-S011205 (EP Impurity E)

Figure 5: The 3D chart summarizing the stability data of the alkaline solution of the sample RM-S011205 (EP Impurity E)
RM-S011207 (EP Impurity G)
After detection, it was found that for the sample RM-S011207 (EP Impurity G), the peak area of the main peak did not change significantly during the 24-hour period when it was placed in acidic and neutral solutions, and the relative standard deviation was less than 2.0%. Therefore, it can be considered that this sample is relatively stable during the 24-hour period when it is placed in acidic and neutral solutions. However, the peak area of the main peak of this sample changed significantly during the 24-hour period when it was placed in an alkaline solution, with a relative standard deviation of 3.26%. As the storage time increases, the peak area of the main peak continuously decreases, and the peak area of the impurity continuously increases, indicating that this sample will gradually degrade over time when placed in an alkaline solution. The peak area data of the main peak of the sample RM-S011207 (EP Impurity G) at each detection point under various pH conditions are as follows:

Figure 6: The line chart summarizing the stability data of the alkaline solution of the sample RM-S011207 (EP Impurity G)

Figure 7: The 3D chart summarizing the stability data of the alkaline solution of the sample RM-S011207 (EP Impurity G)
summary
In conclusion, through this experiment, we found that the sample RM-S011204 (EP Impurity D) has good stability in acidic, neutral, and alkaline solutions. While the samples RM-S011205 (EP Impurity E) and RM-S011207 (EP Impurity G) are stable in acidic and neutral solutions, but they are unstable in alkaline solutions and will gradually degrade slowly over time when placed in alkaline solutions. Therefore, customers should avoid contact with alkalis when using, transporting, and storing the samples RM-S011205 (EP Impurity E) and RM-S011207 (EP Impurity G), and the samples should be prepared and tested immediately during detection. If customers need information about the stability of these three samples, they can consult our company.

Join Our Email List
Subscribe to receive updates on new
products, promotions and resources!
Join Our Email List
Subscribe to receive updates on new
products, promotions and resources!
| ISO 17034:2016 |
| ISO 9001:2015 |

*All our products are for R&D.

*All our products are for R&D.
Copyright © 2021-2024 QCSRM All rights reserved. 粤ICP备2023004355号
Copyright © 2021-2024 QCSRM All rights reserved.
粤ICP备2023004355号